Salvador Hernandez's Team
Unmute


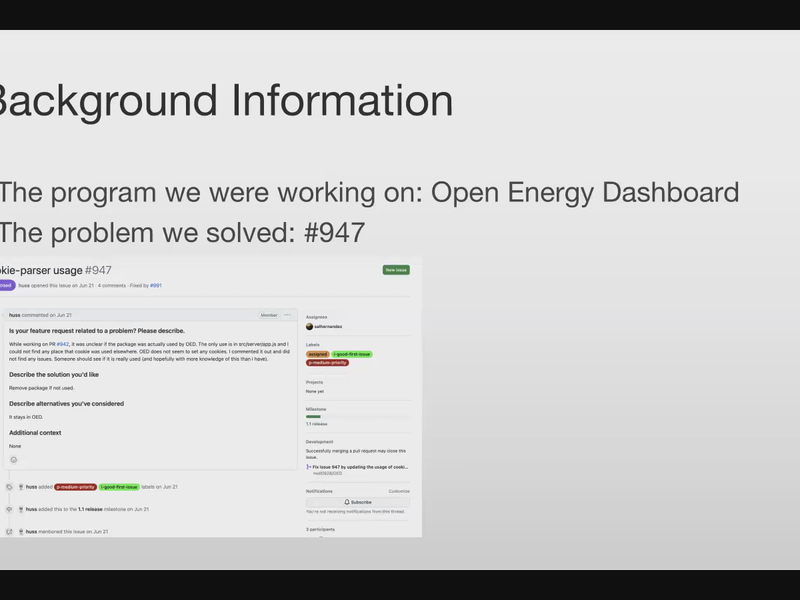
This project is to create contributions to Open Energy Dashboard (OED) - https://github.com/OpenEnergyDashboard/OED
In addition to your mentor, you'll also have access to the OED maintainers.
### Baseline graphing
This involves taking the baseline stored in the database and applying it to the displayed graphics (when the user selects this option). This task will likely be done in a similar way to how area normalization is accomplished. This project can be combined with baseline setting. Difficulty: moderate
What tools did you use to create your project?
How much experience does your group have? Does the project use anything (art, music, starter kits) you didn't create?
CodeDay Labs team in the advanced track.
What challenges did you encounter?
Joette Damo had problems installing Docker into Windows 10 system. Joette had to install WSL Windows Subsystem Linux using Ubuntu in order to use Docker.
Made with 💖 by robots running our open-source software and GraphQL APIs.