Gil Alon's Team
Unmute
This project is to create contributions to Open Energy Dashboard (OED) - https://github.com/OpenEnergyDashboard/OED
#### Error bars
https://github.com/OpenEnergyDashboard/OED/pull/975
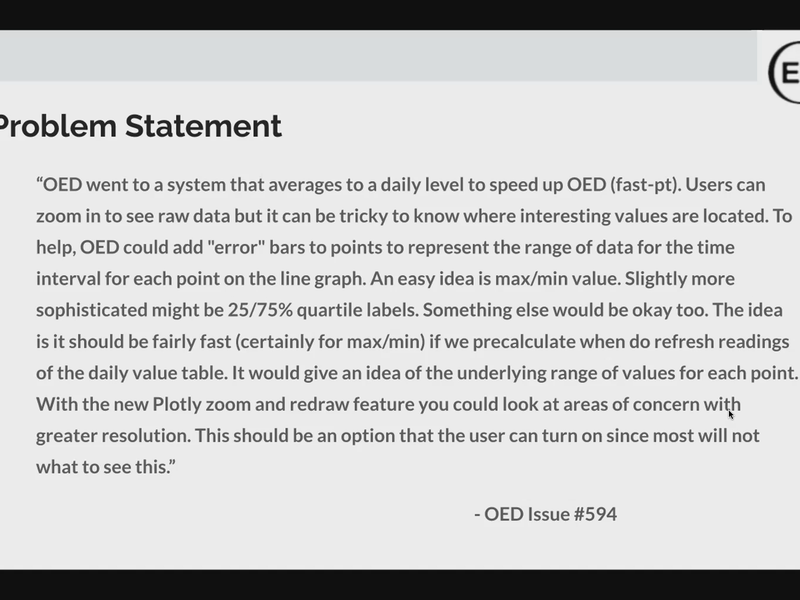
Label each point on the line graphic with the max and min value (error bars) of the averaged data for that point. There is work in progress to make the needed database change to get this data. The next step is to route the data back to the client, have a graphic option to do this and show it on the Plotly graphic.
#### Error bars
https://github.com/OpenEnergyDashboard/OED/pull/975
Label each point on the line graphic with the max and min value (error bars) of the averaged data for that point. There is work in progress to make the needed database change to get this data. The next step is to route the data back to the client, have a graphic option to do this and show it on the Plotly graphic.
What tools did you use to create your project?
How much experience does your group have? Does the project use anything (art, music, starter kits) you didn't create?
Our team (Jesse & Elias) had different backgrounds and experiences.
Elias - had some experience with web applications and was familiar with some of OED's techs, including React, Javscript, and Node.js and databases.
Jesse - didn't have much experience with most of the tech stack. Worked with some JavaScript in the past but never worked with Plotly, SQL, Typescript, react, or redux.
Despite our different experiences in the past, we both managed to learn new technologies and strengthen our problem solving skills.
What challenges did you encounter?
- In the backend particularly in understanding the details of the database and the complex SQL code that computed the min and max data. Since we were not the original author of the original SQL code, understanding its goal, functionality, and how to integrate it properly was initially challenging.
- In the frontend, we were challenged with using Redux since none of us weren't familiar with it before. Working with different Redux related directories such as containers, components, reducers, and actions were all very new concepts to us but were able to learn on the fly and over come this challenge.
- In the frontend, we were challenged with using Redux since none of us weren't familiar with it before. Working with different Redux related directories such as containers, components, reducers, and actions were all very new concepts to us but were able to learn on the fly and over come this challenge.


Made with 💖 by robots running our open-source software and GraphQL APIs.