LiDAR Data Visualization
Unmute

Mentor: Omar Shehata, Graphics engineer at Cesium
Team members: Mehrab Hafiz, Shania Dhani, Yen Lu
Create a web app to visualize LiDAR data from self driving cars.
LiDAR is a way of obtaining an accurate 3D representation of a scene, often used in self driving cars to detect their surroundings. Lyft recently released a large dataset of sensor readings from their self driving car work: https://level5.lyft.com/dataset/
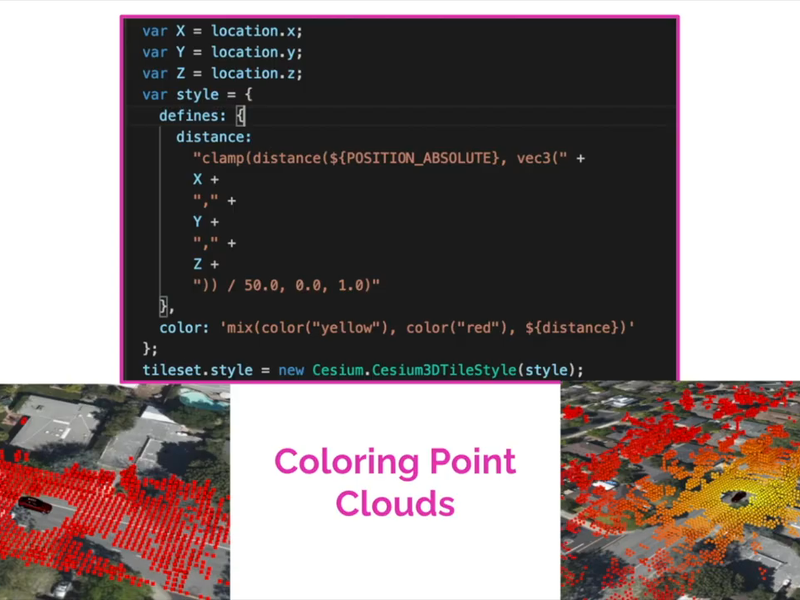
Most analysis done on data like this is done without visualizing all the data together, because it's in different formats/too large to efficiently visualize in real time. This project would involve taking this data, converting it to a standard format that Cesium's pipeline can ingest (likely using Python since it has many of the helper libraries you'll need), and then building an application to visualize it in 3D using Cesium's JavaScript library.
This would not only help people get more insight out of this particular dataset, but would provide a framework for anyone doing self driving car analysis to see their result and share their research. For inspiration you can see how people are analyzing this data in this Kaggle competition:
https://www.kaggle.com/c/3d-object-detection-for-autonomous-vehicles/discussion/109415
How much experience does your group have? Does the project use anything (art, music, starter kits) you didn't create?
CodeDay Labs advanced-track team
Made with 💖 by robots running our open-source software and GraphQL APIs.