Jardi Martinez-Jordan's Team
Unmute
Growing Degree Days (GDD) is a measure of heat accumulation used in agriculture to estimate plant and animal development rates such as the date that a flower will bloom, an insect will emerge from dormancy, or a crop will reach maturity.
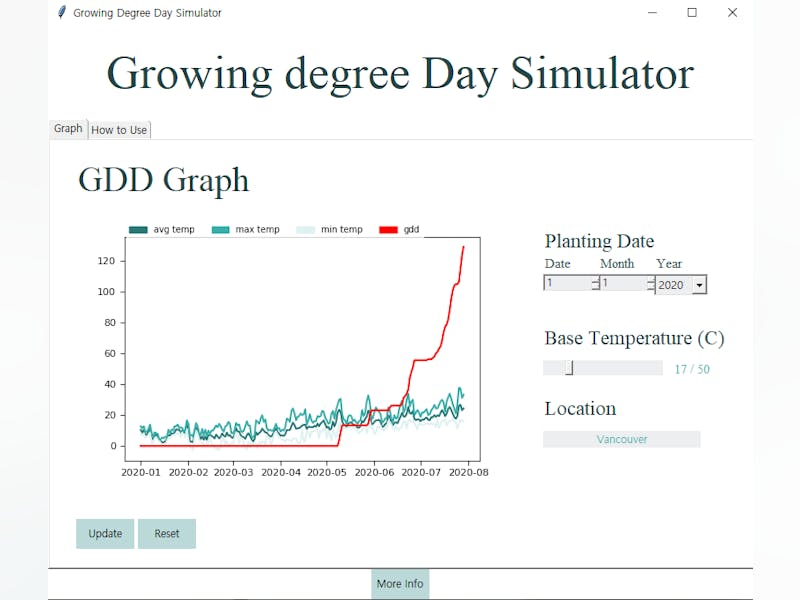
We used Python and the meteostat API to get historical weather data, calculate and plot GDD averages over a given time period, calculate plot accumulated GDD since a given date, and explore other data trends of interest to the students. We used Tkinter for the Graphical User Interface (GUI) and pandas for the data analysis.
We used Python and the meteostat API to get historical weather data, calculate and plot GDD averages over a given time period, calculate plot accumulated GDD since a given date, and explore other data trends of interest to the students. We used Tkinter for the Graphical User Interface (GUI) and pandas for the data analysis.
How much experience does your group have? Does the project use anything (art, music, starter kits) you didn't create?
CodeDay Labs team in the beginner track.
What challenges did you encounter?
Since this was a group effort, one of the main challenges we faced was communication. We fixed this by using Trello to divide up the tasks and by using Slack and Zoom to communicate amongst us.
Made with 💖 by robots running our open-source software and GraphQL APIs.


